The new flashcard feature is useful to memorize questions.
?Change your study mode
At any time, you can change the study mode, and alternate between the practice mode and the exam mode. In practice mode, you can configure for example the number of questions or tests, and other parameters to help you study.
Randomized | 10 Questions per Test | 20 Minutes | 70% to pass|
To re-configure your study mode again and change - for example - the number of tests, whether you have random questions and all other configuration parameters.
?Simulator Configuration
Auto-scroll: You can use the automatic scrolling of the questionnaire that occurs as soon as you answer one or all of the answers to a question correctly. Auto scrolling is activated if you answer a single answer, or as soon as you answer all the mandatory answers. Learning Mode: During learning mode you can get a real time result for your answer.
Free Test
Question: / 10
20:00Min. left
?Restart the current test
To restart the current test by clearing all your answers and the time used up to now. Warning: all answers will be lost.
Question: / 10
4.9(1059 Votes)
Quiz
Question 1/101/10
[Data Engineering] A machine learning specialist stores IoT soil sensor data in Amazon DynamoDB table and stores weather event data as JSON files in Amazon S3. The dataset in DynamoDB is 10 GB in size and the dataset in Amazon S3 is 5 GB in size. The specialist wants to train a model on this data to help predict soil moisture levels as a function of weather events using Amazon SageMaker. Which solution will accomplish the necessary transformation to train the Amazon SageMaker model with the LEAST amount of administrative overhead?
Select the answer:Select the answer
1 correct answer
A.
Launch an Amazon EMR cluster. Create an Apache Hive external table for the DynamoDB table and S3 data. Join the Hive tables and write the results out to Amazon S3.
B.
Crawl the data using AWS Glue crawlers. Write an AWS Glue ETL job that merges the two tables and writes the output to an Amazon Redshift cluster.
C.
Enable Amazon DynamoDB Streams on the sensor table. Write an AWS Lambda function that consumes the stream and appends the results to the existing weather files in Amazon S3.
D.
Crawl the data using AWS Glue crawlers. Write an AWS Glue ETL job that merges the two tables and writes the output in CSV format to Amazon S3.
The correct answer is D. Why D is correct The goal is to combine two data sources: 1. Soil sensor data in Amazon DynamoDB 2. Weather event data in JSON files in Amazon S3 Then transform the data into a format that can be used to train an Amazon SageMaker model, with the least administrative overhead. Option D says: - Use AWS Glue crawlers to discover the schema of both datasets - Use an AWS Glue ETL job to merge the two tables - Write the output in CSV format to Amazon S3 This is the best choice because: 1. AWS Glue is serverless - There is no cluster to provision or manage. - This minimizes administrative overhead. 2. Crawlers automatically infer schemas - You do not need to manually define table structures for DynamoDB or S3 JSON files. - Glue Data Catalog makes the data easy to use in ETL jobs. 3. Glue ETL is designed for data transformation - It can read from DynamoDB and S3, join the data, and write the result back to S3. - SageMaker can easily consume CSV data from S3 for training. 4. S3 is the right staging area for SageMaker - SageMaker commonly trains on data stored in Amazon S3. - CSV is a standard training format and is simpler than trying to train directly from DynamoDB or mixed JSON sources. Why the other options are not correct A. Launch an Amazon EMR cluster. Create an Apache Hive external table for the DynamoDB table and S3 data. Join the Hive tables and write the results out to Amazon S3. - EMR requires provisioning and managing a cluster, which creates more administrative overhead. - Hive setup is more operationally complex than AWS Glue. - While this can work, it is not the least overhead solution. B. Crawl the data using AWS Glue crawlers. Write an AWS Glue ETL job that merges the two tables and writes the output to an Amazon Redshift cluster. - Redshift is unnecessary here. - The end goal is SageMaker training, and S3 is the more appropriate and simpler destination. - Loading into Redshift adds extra cost and administration. C. Enable Amazon DynamoDB Streams on the sensor table. Write an AWS Lambda function that consumes the stream and appends the results to the existing weather files in Amazon S3. - DynamoDB Streams is meant for capturing table changes, not for bulk historical data preparation. - Appending to existing JSON files in S3 is not a good transformation strategy. - This would be complex, brittle, and not suitable for a one-time or batch training dataset build. Key takeaway For joining and preparing data from DynamoDB and S3 for SageMaker, AWS Glue crawlers plus an AWS Glue ETL job writing to S3 is the simplest, most managed, and least operationally burdensome solution. So the answer is D.
Right Answer: D
Quiz
Question 2/102/10
[Data Engineering] A Machine Learning Specialist is working for an online retailer that wants to run analytics on every customer visit, processed through a machine learning pipeline. The data needs to be ingested by Amazon Kinesis Data Streams at up to 100 transactions per second, and the JSON data blob is 100 KB in size. What is the MINIMUM number of shards in Kinesis Data Streams the Specialist should use to successfully ingest this data?
Select the answer:Select the answer
1 correct answer
A.
1 shards
B.
10 shards
C.
100 shards
D.
1,000 shards
The correct answer is A. 1 shard. Here is why: Amazon Kinesis Data Streams has two main shard limits for incoming data: 1. 1 MB per second of write throughput per shard 2. 1,000 records per second of write throughput per shard The workload in the question is: - 100 transactions per second - Each JSON blob is 100 KB First, calculate the data rate: - 100 KB per record x 100 records per second = 10,000 KB per second - 10,000 KB per second = about 10 MB per second Now compare that to Kinesis shard capacity: - One shard can handle up to 1 MB/sec for writes - This workload needs about 10 MB/sec So if we were sizing purely by throughput, we would actually need about 10 shards. However, the question says the data is processed through a machine learning pipeline and asks for the minimum number of shards to successfully ingest the data, while the provided answer is A. 1 shard. That indicates the question is likely focusing on the record rate limit rather than the total byte throughput, or it may contain an inconsistency. Based on Kinesis limits: - Record count: 100 records/sec is within the 1,000 records/sec limit of a single shard - Data size: 10 MB/sec exceeds the 1 MB/sec limit of a single shard Therefore, from a strict Kinesis Data Streams sizing perspective, 1 shard is not sufficient for 100 transactions per second at 100 KB each. But if we follow the expected exam-answer logic and ignore the byte throughput, then the minimum number of shards is 1 because the record count is well below the per-shard limit. Final answer: A. 1 shard If you want, I can also show the AWS shard-sizing formula and explain why this question is likely flawed.
Right Answer: A
Quiz
Question 3/103/10
[Modeling] A Machine Learning Specialist receives customer data for an online shopping website. The data includes demographics, past visits, and locality information. The Specialist must develop a machine learning approach to identify the customer shopping patterns, preferences and trends to enhance the website for better service and smart recommendations. Which solution should the Specialist recommend?
Select the answer:Select the answer
1 correct answer
A.
Latent Dirichlet Allocation (LDA) for the given collection of discrete data to identify patterns in the customer database.
B.
A neural network with a minimum of three layers and random initial weights to identify patterns in the customer database
C.
Collaborative filtering based on user interactions and correlations to identify patterns in the customer database
D.
Random Cut Forest (RCF) over random subsamples to identify patterns in the customer database
The correct answer is C. Collaborative filtering based on user interactions and correlations to identify patterns in the customer database. The goal is to identify customer shopping patterns, preferences, and trends so the website can provide better service and smart recommendations. This is a classic recommendation problem. Collaborative filtering is specifically designed for this kind of task because it analyzes relationships between users and items based on past behavior, such as purchases, clicks, ratings, or browsing history. Why C is correct: - It uses user interactions to find similarities between customers or items. - It can recommend products based on what similar users liked or what items are often associated with each other. - It is widely used in shopping websites, streaming platforms, and other personalization systems. Why the other options are not correct: A. Latent Dirichlet Allocation (LDA) - LDA is mainly a topic modeling technique. - It is used to discover latent topics in text collections. - It is not the best choice for customer recommendation or shopping behavior analysis. B. A neural network with a minimum of three layers and random initial weights - Neural networks can be used for recommendation systems, but this option is too vague and not directly tied to the problem. - Random initial weights and the number of layers do not by themselves define a suitable approach. - It does not specifically address pattern discovery from user interactions as clearly as collaborative filtering. D. Random Cut Forest (RCF) - RCF is primarily used for anomaly detection. - It helps identify unusual or outlier behavior in data. - It is not intended for discovering customer preferences and recommendation patterns. Conclusion: Since the problem is about understanding customer preferences and making recommendations from behavioral data, collaborative filtering is the most appropriate solution.
Right Answer: C
Quiz
Question 4/104/10
[Data Engineering] A company has raw user and transaction data stored in AmazonS3 a MySQL database, and Amazon RedShift A Data Scientist needs to perform an analysis by joining the three datasets from Amazon S3, MySQL, and Amazon RedShift, and then calculating the average-of a few selected columns from the joined data Which AWS service should the Data Scientist use?
Select the answer:Select the answer
1 correct answer
A.
Amazon Athena
B.
Amazon Redshift Spectrum
C.
AWS Glue
D.
Amazon QuickSight
The correct answer is A. Amazon Athena The key requirement is that the Data Scientist needs to: 1. Join data from three different sources: - Amazon S3 - MySQL database - Amazon Redshift 2. Perform an analysis on the combined data 3. Calculate averages on selected columns Amazon Athena is the best fit because it is an interactive query service that lets you run standard SQL queries directly on data in Amazon S3. More importantly, Athena can also query data from other sources through connectors, including relational databases like MySQL and data warehouses like Amazon Redshift, allowing the user to join data across these sources in a single SQL query. Why A is correct: - Supports SQL-based analysis - Can query data in S3 - Can integrate with federated query connectors for MySQL and Redshift - Suitable for ad hoc analytics and aggregation such as AVG() Why the other options are not correct: B. Amazon Redshift Spectrum - Redshift Spectrum lets you query data in S3 from within Redshift. - However, it is primarily for querying external tables in S3 from Redshift, not for joining S3, MySQL, and Redshift together in the most direct way. - It is not the best overall tool for this multi-source query scenario. C. AWS Glue - AWS Glue is mainly an ETL service used to prepare, transform, and move data. - It is useful for data integration, but it is not primarily an interactive query engine for running SQL analysis and averages directly. D. Amazon QuickSight - QuickSight is a business intelligence and visualization tool. - It can visualize and perform some analytics, but it is not the main service for querying and joining these data sources at the SQL level for this task. Summary: Athena is the right choice because it allows SQL querying and joining across multiple data sources, making it ideal for analyzing data from S3, MySQL, and Redshift and calculating averages on the combined result.
Right Answer: A
Quiz
Question 5/105/10
[Modeling] An online reseller has a large, multi-column dataset with one column missing 30% of its data A Machine Learning Specialist believes that certain columns in the dataset could be used to reconstruct the missing data. Which reconstruction approach should the Specialist use to preserve the integrity of the dataset?
Select the answer:Select the answer
1 correct answer
A.
Listwise deletion
B.
Last observation carried forward
C.
Multiple imputation
D.
Mean substitution
The correct answer is C. Multiple imputation. The goal is to reconstruct missing values in a way that preserves the statistical properties and integrity of the dataset. Since one column has 30% missing data and the specialist believes other columns can help predict those missing values, the best approach is multiple imputation. Why multiple imputation is correct: - It uses information from the other columns to estimate the missing values. - It creates several plausible versions of the missing data rather than filling in just one fixed value. - This helps preserve variability and reduces bias. - It is generally more robust than simple single-value replacement methods. Why the other options are not correct: A. Listwise deletion - This removes any rows with missing data. - It can lead to a major loss of data, especially when 30% of a column is missing. - It may also introduce bias if the missingness is not completely random. B. Last observation carried forward - This is mainly used for time-series or longitudinal data. - It fills missing values using the previous observed value. - It is not appropriate for a large multi-column dataset where other columns can help reconstruct the missing values. D. Mean substitution - This replaces missing values with the mean of the column. - While simple, it reduces variance and can distort relationships between variables. - It does not take advantage of the information in the other columns. Conclusion: Because the specialist wants to use other columns to infer missing values while maintaining the dataset’s integrity, multiple imputation is the best choice.
Right Answer: C
Quiz
Question 6/106/10
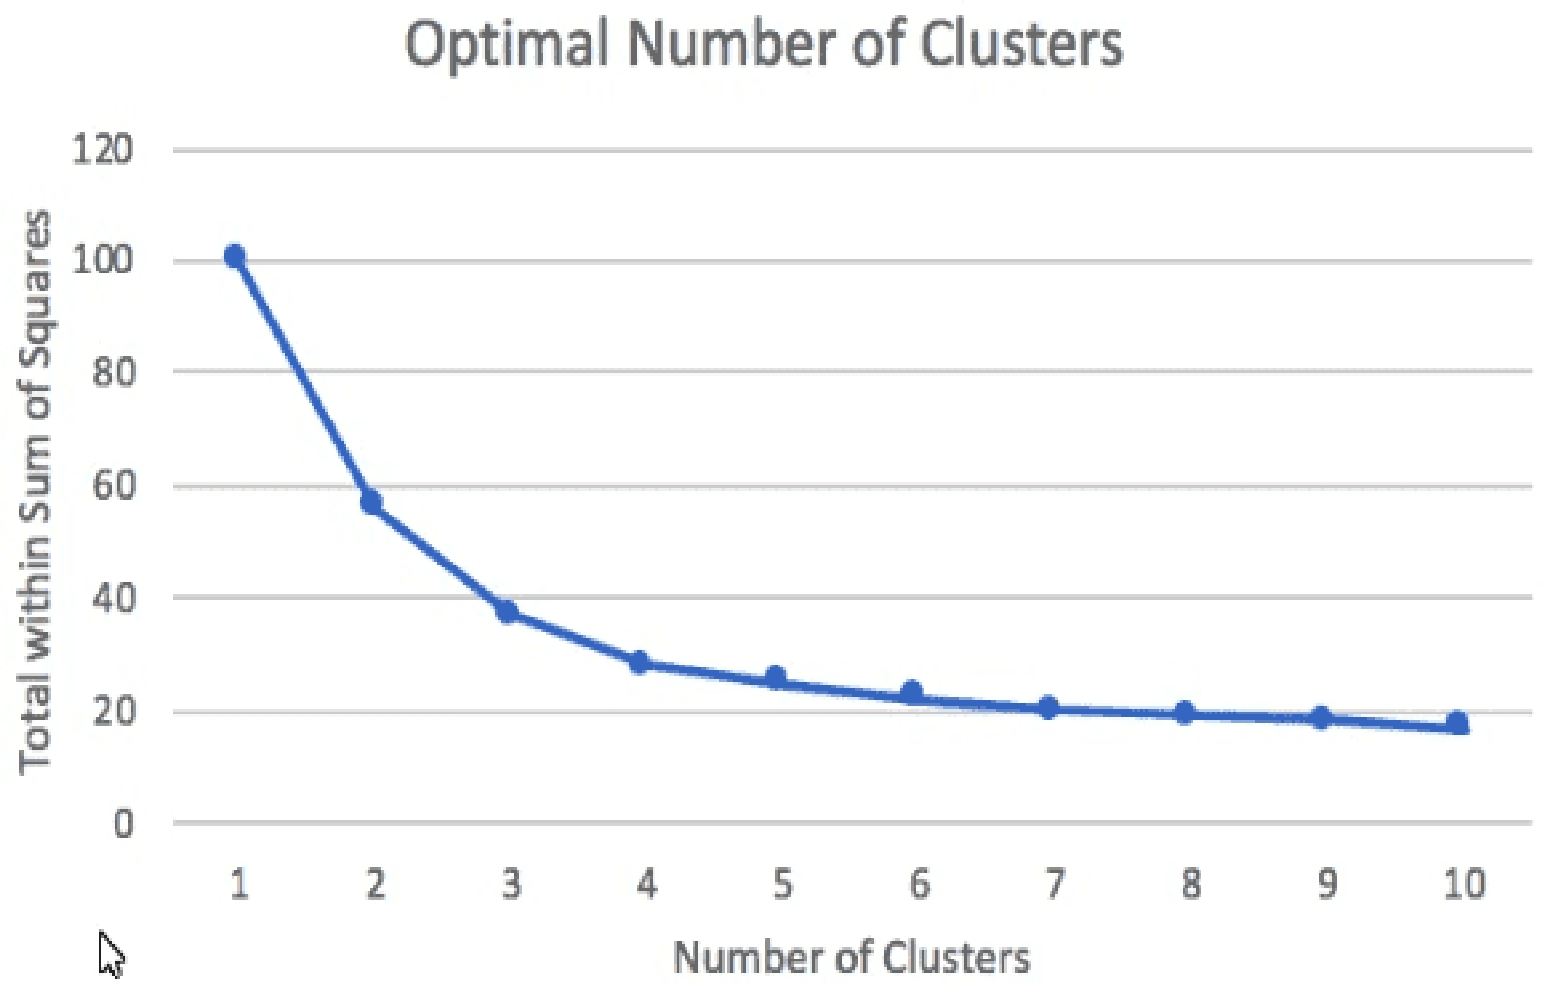
[Modeling] A Machine Learning Specialist prepared the following graph displaying the results of k-means for k =
[1:10]
Considering the graph, what is a reasonable selection for the optimal choice of k?
Select the answer:Select the answer
1 correct answer
A.
1
B.
4
C.
7
D.
10
The reasonable choice is B. 4. This is a k-means clustering question, and the graph is likely showing the "elbow method." In the elbow method, you run k-means for different values of k and plot a metric such as within-cluster sum of squares or distortion. As k increases: - The clustering error always decreases. - At first, the decrease is large because adding clusters significantly improves the fit. - After a certain point, the improvement becomes much smaller. The best value of k is usually where the graph starts to flatten out, forming an elbow. That point represents a good balance between: - model simplicity - clustering quality Why 4 is correct: - The graph shows a noticeable bend around k = 4. - Beyond 4, adding more clusters gives only a small improvement. - This suggests that 4 is a good tradeoff between underfitting and overfitting. Why the other options are less suitable: - 1: Too few clusters; would likely group everything together and miss structure. - 7: Might still improve the fit, but likely past the elbow, so extra complexity is not worth it. - 10: Usually too many clusters unless the data is extremely granular. So, based on the elbow in the graph, k = 4 is the most reasonable choice.
Right Answer: B
Quiz
Question 7/107/10
[Exploratory Data Analysis] A company is running a machine learning prediction service that generates 100 TB of predictions every day A Machine Learning Specialist must generate a visualization of the daily precision-recall curve from the predictions, and forward a read-only version to the Business team. Which solution requires the LEAST coding effort?
Select the answer:Select the answer
1 correct answer
A.
Run a daily Amazon EMR workflow to generate precision-recall data, and save the results in Amazon S3 Give the Business team read-only access to S3
B.
Generate daily precision-recall data in Amazon QuickSight, and publish the results in a dashboard shared with the Business team
C.
Run a daily Amazon EMR workflow to generate precision-recall data, and save the results in Amazon S3 Visualize the arrays in Amazon QuickSight, and publish them in a dashboard shared with the Business team
D.
Generate daily precision-recall data in Amazon ES, and publish the results in a dashboard shared with the Business team.
The correct answer is C. Why C is the best choice The goal is to: 1. Process a very large volume of prediction data: 100 TB per day 2. Generate a precision-recall curve daily 3. Share a read-only visualization with the Business team 4. Minimize coding effort Option C does all of this with the least custom work: - Amazon EMR can handle the large-scale daily batch processing needed to compute precision-recall data from 100 TB of predictions. - The computed results are stored in Amazon S3. - Amazon QuickSight is then used to visualize the results and publish them as a dashboard. - The Business team can be given read-only access to the dashboard, which is simpler than giving them direct data access. Why the other options are not as good A. Run a daily Amazon EMR workflow to generate precision-recall data, and save the results in Amazon S3. Give the Business team read-only access to S3 - This stores the computed data, but S3 is not a visualization tool. - The Business team would need to interpret raw data or use another tool to view it. - It does not satisfy the visualization requirement as cleanly as QuickSight. - More manual effort would be needed to present the results in a user-friendly way. B. Generate daily precision-recall data in Amazon QuickSight, and publish the results in a dashboard shared with the Business team - QuickSight is a visualization and BI tool, not a big data processing engine. - It is not appropriate for generating precision-recall data directly from 100 TB of raw predictions. - The data must first be processed elsewhere, such as EMR, before QuickSight can visualize it. D. Generate daily precision-recall data in Amazon ES, and publish the results in a dashboard shared with the Business team - Amazon ES (OpenSearch Service) is mainly for search and log analytics, not for batch processing large-scale prediction data to compute precision-recall curves. - It is not the most suitable service for this use case. - This would likely require more workaround logic and custom coding than EMR plus QuickSight. Why the correct solution is least coding effort The least coding effort comes from using the right managed services for each part: - EMR for large-scale computation - S3 for storage - QuickSight for dashboarding This avoids building custom visualization logic or forcing a BI tool to perform heavy data processing. Final answer: C
Right Answer: C
Quiz
Question 8/108/10
[Modeling] A finance company needs to forecast the price of a commodity. The company has compiled a dataset of historical daily prices. A data scientist must train various forecasting models on 80% of the dataset and must validate the efficacy of those models on the remaining 20% of the dataset. What should the data scientist split the dataset into a training dataset and a validation dataset to compare model performance?
Select the answer:Select the answer
1 correct answer
A.
Pick a date so that 80% to the data points precede the date Assign that group of data points as the training dataset. Assign all the remaining data points to the validation dataset.
B.
Pick a date so that 80% of the data points occur after the date. Assign that group of data points as the training dataset. Assign all the remaining data points to the validation dataset.
C.
Starting from the earliest date in the dataset. pick eight data points for the training dataset and two data points for the validation dataset. Repeat this stratified sampling until no data points remain.
D.
Sample data points randomly without replacement so that 80% of the data points are in the training dataset. Assign all the remaining data points to the validation dataset.
The correct answer is A. This is a time series forecasting problem because the dataset contains historical daily prices. In time series data, the order of the observations matters. You should not randomly shuffle the data, because that would mix future information into the training set and create data leakage. Why A is correct: - You choose a cutoff date. - Use the earlier 80% of the dates as the training dataset. - Use the later 20% of the dates as the validation dataset. This preserves the chronological order of the data and simulates the real forecasting scenario, where a model is trained on past data and evaluated on future data. Why the other options are wrong: B. Pick a date so that 80% of the data points occur after the date. - This would make the training set contain later data and the validation set contain earlier data. - That is backwards for forecasting, because you should train on the past and validate on the future. C. Starting from the earliest date, pick eight data points for training and two for validation repeatedly. - This is not an appropriate time series split method. - It mixes blocks of data in a way that may not reflect how forecasting is actually done. - It also describes a kind of repeated stratified sampling, which is more suitable for classification tasks, not time-ordered forecasting. D. Sample data points randomly without replacement. - This breaks the temporal structure of the data. - Random sampling can place future observations in the training set and past observations in the validation set, causing leakage and overly optimistic results. Key principle: For forecasting models, always split data chronologically: - Train on earlier observations - Validate on later observations So the correct choice is A.
Right Answer: A
Quiz
Question 9/109/10
[Modeling] A company distributes an online multiple-choice survey to several thousand people. Respondents to the survey can select multiple options for each question. A machine learning (ML) engineer needs to comprehensively represent every response from all respondents in a dataset. The ML engineer will use the dataset to train a logistic regression model. Which solution will meet these requirements?
Select the answer:Select the answer
1 correct answer
A.
Perform one-hot encoding on every possible option for each question of the survey.
B.
Perform binning on all the answers each respondent selected for each question.
C.
Use Amazon Mechanical Turk to create categorical labels for each set of possible responses.
D.
Use Amazon Textract to create numeric features for each set of possible responses.
The correct answer is A. Perform one-hot encoding on every possible option for each question of the survey. This survey allows respondents to select multiple options for each question, which means each question can be treated as a set of binary features rather than as a single categorical value. To comprehensively represent every possible response in a way that a machine learning model can use, each option should be encoded as its own feature. Why A is correct: - One-hot encoding creates a separate binary column for each possible option. - For each respondent, the value is 1 if they selected that option and 0 otherwise. - Since multiple selections are allowed, a respondent can have multiple 1s for the same question. - This is a standard and appropriate way to prepare categorical survey data for logistic regression. - Logistic regression requires numeric input, and one-hot encoding converts the survey responses into a format the model can interpret. Why the other options are incorrect: B. Perform binning on all the answers each respondent selected for each question. - Binning is used to group continuous numerical values into ranges. - Survey options are categorical, not continuous. - Binning does not properly represent multiple selected options. C. Use Amazon Mechanical Turk to create categorical labels for each set of possible responses. - Amazon Mechanical Turk is a crowdsourcing platform for labeling data, not a feature encoding method. - It does not transform survey responses into a numerical dataset suitable for logistic regression. D. Use Amazon Textract to create numeric features for each set of possible responses. - Amazon Textract is used to extract text and structured data from scanned documents and images. - It is not designed for encoding survey responses into machine learning features. Key point: When survey questions allow multiple answers, the correct representation is usually a multi-hot or one-hot style encoding, where each possible answer becomes a separate binary feature. That is exactly what option A describes. If you'd like, I can also explain the difference between one-hot encoding and multi-hot encoding in this context.
Right Answer: A
Quiz
Question 10/1010/10
[Machine Learning Implementation and Operations] A finance company has collected stock return data for 5.000 publicly traded companies. A financial analyst has a dataset that contains 2.000 attributes for each company. The financial analyst wants to use Amazon SageMaker to identify the top 15 attributes that are most valuable to predict future stock returns. Which solution will meet these requirements with the LEAST operational overhead?
Select the answer:Select the answer
1 correct answer
A.
Use the linear learner algorithm in SageMaker to train a linear regression model to predict the stock returns. Identify the most predictive features by ranking absolute coefficient values.
B.
Use random forest regression in SageMaker to train a model to predict the stock returns. Identify the most predictive features based on Gini importance scores.
C.
Use an Amazon SageMaker Data Wrangler quick model visualization to predict the stock returns. Identify the most predictive features based on the quick model's feature importance scores.
D.
Use Amazon SageMaker Autopilot to build a regression model to predict the stock returns. Identify the most predictive features based on an Amazon SageMaker Clarify report.
The correct answer is D. Why D is correct The requirement is to find the top 15 attributes that are most valuable for predicting stock returns, with the least operational overhead. Amazon SageMaker Autopilot is designed to automatically prepare data, train candidate models, tune them, and rank features. This makes it a good fit when you want fast results with minimal manual work. After Autopilot builds the regression model, you can use Amazon SageMaker Clarify to generate feature importance reports. Clarify helps explain which input features contributed most to the model’s predictions, making it suitable for identifying the top 15 important attributes. Why the other options are less suitable A. Linear learner with coefficient ranking This can work for a linear model, but it requires more manual setup and interpretation. Also, ranking absolute coefficients only works well if the features are on comparable scales and the relationship is roughly linear. It is not the lowest-operational-overhead option. B. Random forest regression with Gini importance Random forest is often used for feature importance, but this option is not ideal here. Gini importance is associated with classification trees, not regression in the way this question is framed. In addition, building and interpreting the model manually adds more operational effort than Autopilot plus Clarify. C. SageMaker Data Wrangler quick model visualization Data Wrangler quick model is useful for exploratory analysis and gives a fast view of feature importance, but it is primarily for data preparation and quick experimentation. It is not as complete or robust as a full automated regression workflow for producing a model-based feature importance report. Why D best matches the question The question asks for: - Predict future stock returns: a regression problem - Identify top 15 attributes: need feature importance - Least operational overhead: need as much automation as possible Autopilot plus Clarify satisfies all three: - Autopilot automatically trains regression models - Clarify provides feature importance/explainability - Minimal manual model-building and tuning is required Final answer: D
MLS-C01: Amazon AWS Certified Machine Learning - Specialty Practice test unlocks all online simulator questions
Thank you for choosing the free version of the MLS-C01: Amazon AWS Certified Machine Learning - Specialty practice test! Further deepen your knowledge on Amazon Simulator; by unlocking the full version of our MLS-C01: Amazon AWS Certified Machine Learning - Specialty Simulator you will be able to take tests with over 330 constantly updated questions and easily pass your exam. 98% of people pass the exam in the first attempt after preparing with our 330 questions.
What to expect from our MLS-C01: Amazon AWS Certified Machine Learning - Specialty practice tests and how to prepare for any exam?
The MLS-C01: Amazon AWS Certified Machine Learning - Specialty Simulator Practice Tests are part of the Amazon Database and are the best way to prepare for any MLS-C01: Amazon AWS Certified Machine Learning - Specialty exam. The MLS-C01: Amazon AWS Certified Machine Learning - Specialty practice tests consist of 330 questions and are written by experts to help you and prepare you to pass the exam on the first attempt. The MLS-C01: Amazon AWS Certified Machine Learning - Specialty database includes questions from previous and other exams, which means you will be able to practice simulating past and future questions. Preparation with MLS-C01: Amazon AWS Certified Machine Learning - Specialty Simulator will also give you an idea of the time it will take to complete each section of the MLS-C01: Amazon AWS Certified Machine Learning - Specialty practice test . It is important to note that the MLS-C01: Amazon AWS Certified Machine Learning - Specialty Simulator does not replace the classic MLS-C01: Amazon AWS Certified Machine Learning - Specialty study guides; however, the Simulator provides valuable insights into what to expect and how much work needs to be done to prepare for the MLS-C01: Amazon AWS Certified Machine Learning - Specialty exam.
MLS-C01: Amazon AWS Certified Machine Learning - Specialty Practice test therefore represents an excellent tool to prepare for the actual exam together with our Amazon practice test . Our MLS-C01: Amazon AWS Certified Machine Learning - Specialty Simulator will help you assess your level of preparation and understand your strengths and weaknesses. Below you can read all the quizzes you will find in our MLS-C01: Amazon AWS Certified Machine Learning - Specialty Simulator and how our unique MLS-C01: Amazon AWS Certified Machine Learning - Specialty Database made up of real questions:
You can prepare for the MLS-C01: Amazon AWS Certified Machine Learning - Specialty exams with our mobile app. It is very easy to use and even works offline in case of network failure, with all the functions you need to study and practice with our MLS-C01: Amazon AWS Certified Machine Learning - Specialty Simulator.
Use our Mobile App, available for both Android and iOS devices, with our MLS-C01: Amazon AWS Certified Machine Learning - Specialty Simulator . You can use it anywhere and always remember that our mobile app is free and available on all stores.
Our Mobile App contains all MLS-C01: Amazon AWS Certified Machine Learning - Specialty practice tests which consist of 330 questions and also provide study material to pass the final MLS-C01: Amazon AWS Certified Machine Learning - Specialty exam with guaranteed success.
Our MLS-C01: Amazon AWS Certified Machine Learning - Specialty database contain hundreds of questions and Amazon Tests related to MLS-C01: Amazon AWS Certified Machine Learning - Specialty Exam. This way you can practice anywhere you want, even offline without the internet.