The new flashcard feature is useful to memorize questions.
?Change your study mode
At any time, you can change the study mode, and alternate between the practice mode and the exam mode. In practice mode, you can configure for example the number of questions or tests, and other parameters to help you study.
Randomized | 10 Questions per Test | 20 Minutes | 70% to pass|
To re-configure your study mode again and change - for example - the number of tests, whether you have random questions and all other configuration parameters.
?Simulator Configuration
Auto-scroll: You can use the automatic scrolling of the questionnaire that occurs as soon as you answer one or all of the answers to a question correctly. Auto scrolling is activated if you answer a single answer, or as soon as you answer all the mandatory answers. Learning Mode: During learning mode you can get a real time result for your answer.
Free Test
Question: / 10
20:00Min. left
?Restart the current test
To restart the current test by clearing all your answers and the time used up to now. Warning: all answers will be lost.
Question: / 10
4.6(747 Votes)
Quiz
Question 1/101/10
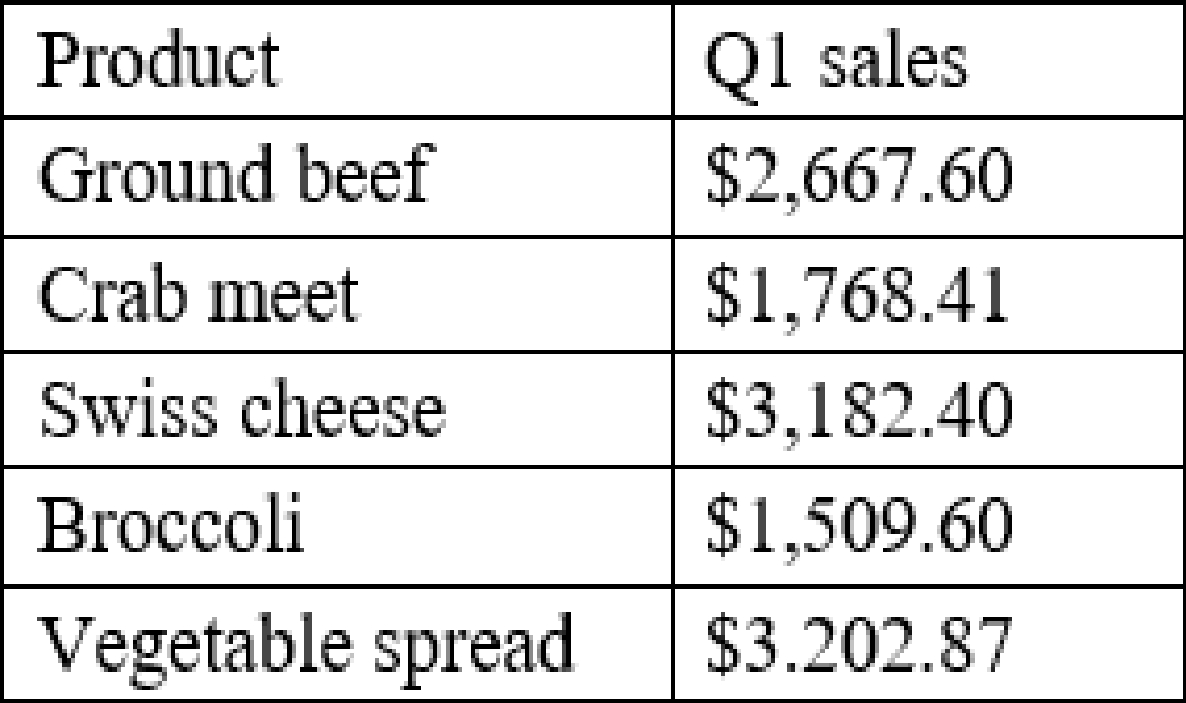
A data analyst needs to calculate the mean for Q1 sales using the data set below:
Which of the following is the mean?
Select the answer:Select the answer
1 correct answer
A.
$2,466.18
B.
$2,667.60
C.
$3,082.72
D.
$12,330.88
The mean is the average of all the values in a data set. To calculate the mean, we add up all the values and divide by the number of values. In this case, the mean for Q1 sales is ($2,000 + $3,000 + $4,000 + $2,500 + $3,500) / 5 = $3,082.72 Reference: CompTIA Data+ Certification Exam Objectives, page 9
Right Answer: C
Quiz
Question 2/102/10
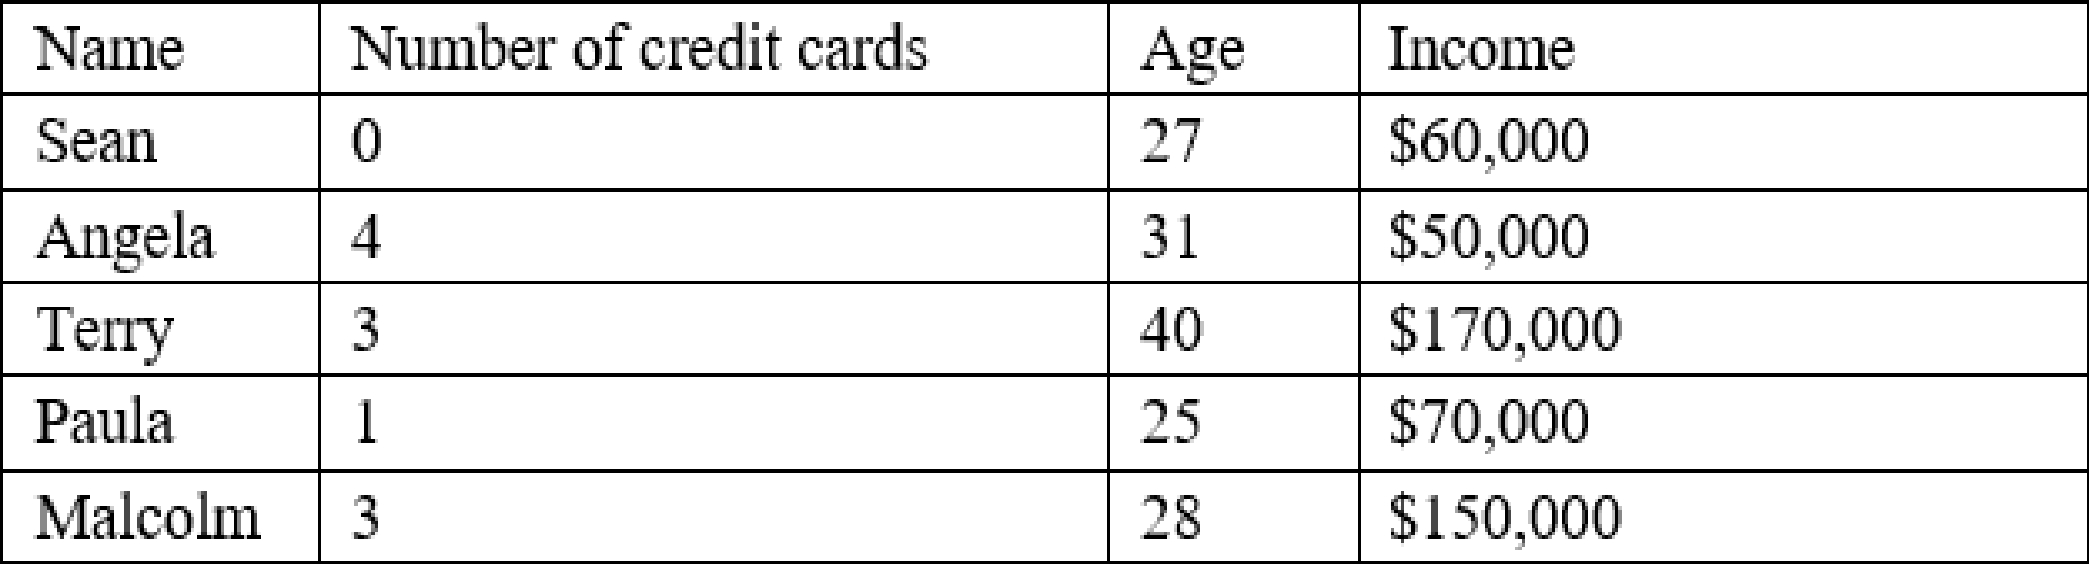
V A customer list from a financial services company is shown below:
A data analyst wants to create a likely-to-buy score on a scale from 0 to 100, based on an average of the three numerical variables: number of credit cards, age, and income. Which of the following should the analyst do to the variables to ensure they all have the same weight in the score calculation?
Select the answer:Select the answer
1 correct answer
A.
Recode the variables.
B.
Calculate the percentiles of the variables.
C.
Calculate the standard deviations of the variables.
D.
Normalize the variables.
Normalizing the variables means scaling them to a common range, such as 0 to 1 or -1 to 1, so that they have the same weight in the score calculation. Recoding the variables means changing their values or categories, which would alter their meaning and distribution. Calculating the percentiles of the variables means ranking them relative to each other, which would not account for their actual magnitudes. Calculating the standard deviations of the variables means measuring their variability, which would not make them comparable. Reference: CompTIA Data+ Certification Exam Objectives, page 10
Right Answer: D
Quiz
Question 3/103/10
Which of the following actions should be taken when transmitting data to mitigate the chance of a data leak occurring? (Choose two.)
Select multiple answer: (Choose 2)Select the answer
2 correct answers
A.
Data identification v
B.
Data processing
C.
Data Reporting
D.
Data encryption
E.
Data masking
F.
Fata removal
Data encryption and data masking are two actions that can be taken when transmitting data to mitigate the chance of a data leak occurring. Data encryption means transforming data into an unreadable format that can only be decrypted with a key. Data masking means hiding or replacing sensitive data with fictitious or anonymized data. Both methods protect the confidentiality and integrity of the data in transit. Reference: CompTIA Data+ Certification Exam Objectives, page 13
Right Answer: D, E
Quiz
Question 4/104/10
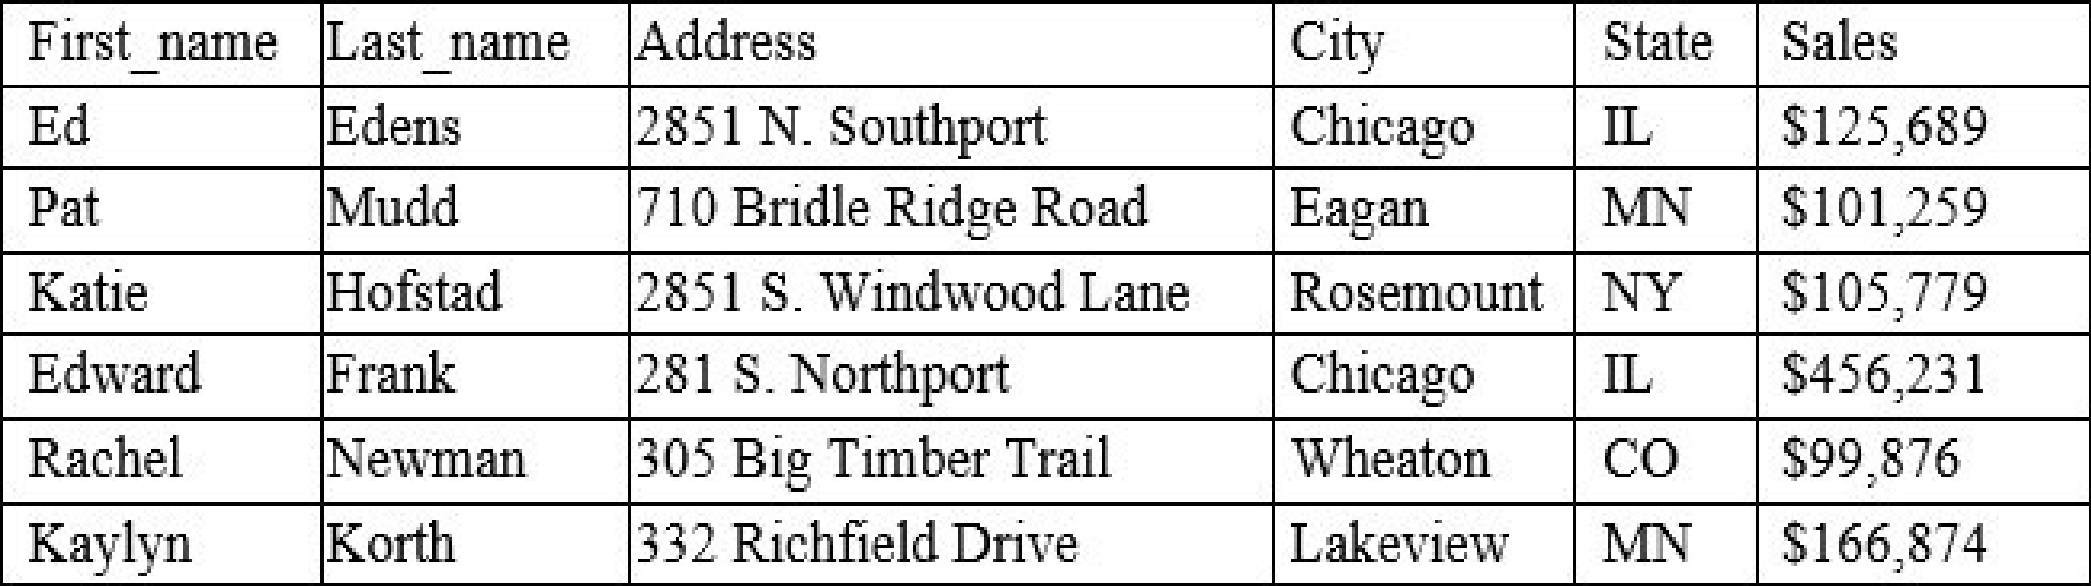
A data analyst has been asked to organize the table below in the following ways: By sales from high to low -
By state in alphabetic order -
Which of the following functions will allow the data analyst to organize the table in this manner?
Select the answer:Select the answer
1 correct answer
A.
Conditional formatting
B.
Grouping
C.
Filtering
D.
Sorting
Sorting is the function that will allow the data analyst to organize the table in the desired manner. Sorting means arranging the data in a specific order, such as ascending or descending, based on one or more criteria. Sorting can be applied to any column in the table, such as sales or state. Reference: CompTIA Data+ Certification Exam Objectives, page 11
Right Answer: D
Quiz
Question 5/105/10
Which of the following BEST describes the issue in which character values are mixed with integer values in a data set column?
Select the answer:Select the answer
1 correct answer
A.
Duplicate data
B.
Missing data
C.
Data outliers
D.
Invalid data type
The invalid data type is the best description for the issue in which character values are mixed with integer values in a data set column. Invalid data type means that the data does not match the expected or required format or structure for a given variable or attribute. For example, if a columnis supposed to store numerical values, but some rows contain text values, then those rows have an invalid data type. Reference: CompTIA Data+ Certification Exam Objectives, page 10
Right Answer: D
Quiz
Question 6/106/10
Which of the following is a process that is used during data integration to collect, blend, and load data?
Select the answer:Select the answer
1 correct answer
A.
MDM
B.
ETL
C.
OLTP
D.
BI
ETL is a process that is used during data integration to collect, blend, and load data. ETL stands for extract, transform, and load, which are the three main steps involved in moving data from different sources to a common destination, such as a data warehouse or a data lake. ETL helps to consolidate and standardize data for analysis and reporting purposes. Reference: CompTIA Data+ Certification Exam Objectives, page 12
Right Answer: B
Quiz
Question 7/107/10
An analyst has received the requirements for an internal user dashboard. The analyst confirms the data sources and then creates a wireframe. Which of the following is the NEXT step the analyst should take in the dashboard creation process?
Select the answer:Select the answer
1 correct answer
A.
Optimize the dashboard.
B.
Create subscriptions.
C.
Get stakeholder approval.
D.
Deploy to production.
Getting stakeholder approval is the next step the analyst should take in the dashboard creation process, after confirming the data sources and creating a wireframe. Stakeholder approval means getting feedback and validation from the intended users or clients of the dashboard, to ensure that it meets their expectations and requirements. This step helps to avoid rework and ensure customer satisfaction. Reference: CompTIA Data+ Certification Exam Objectives, page 14
Right Answer: C
Quiz
Question 8/108/10
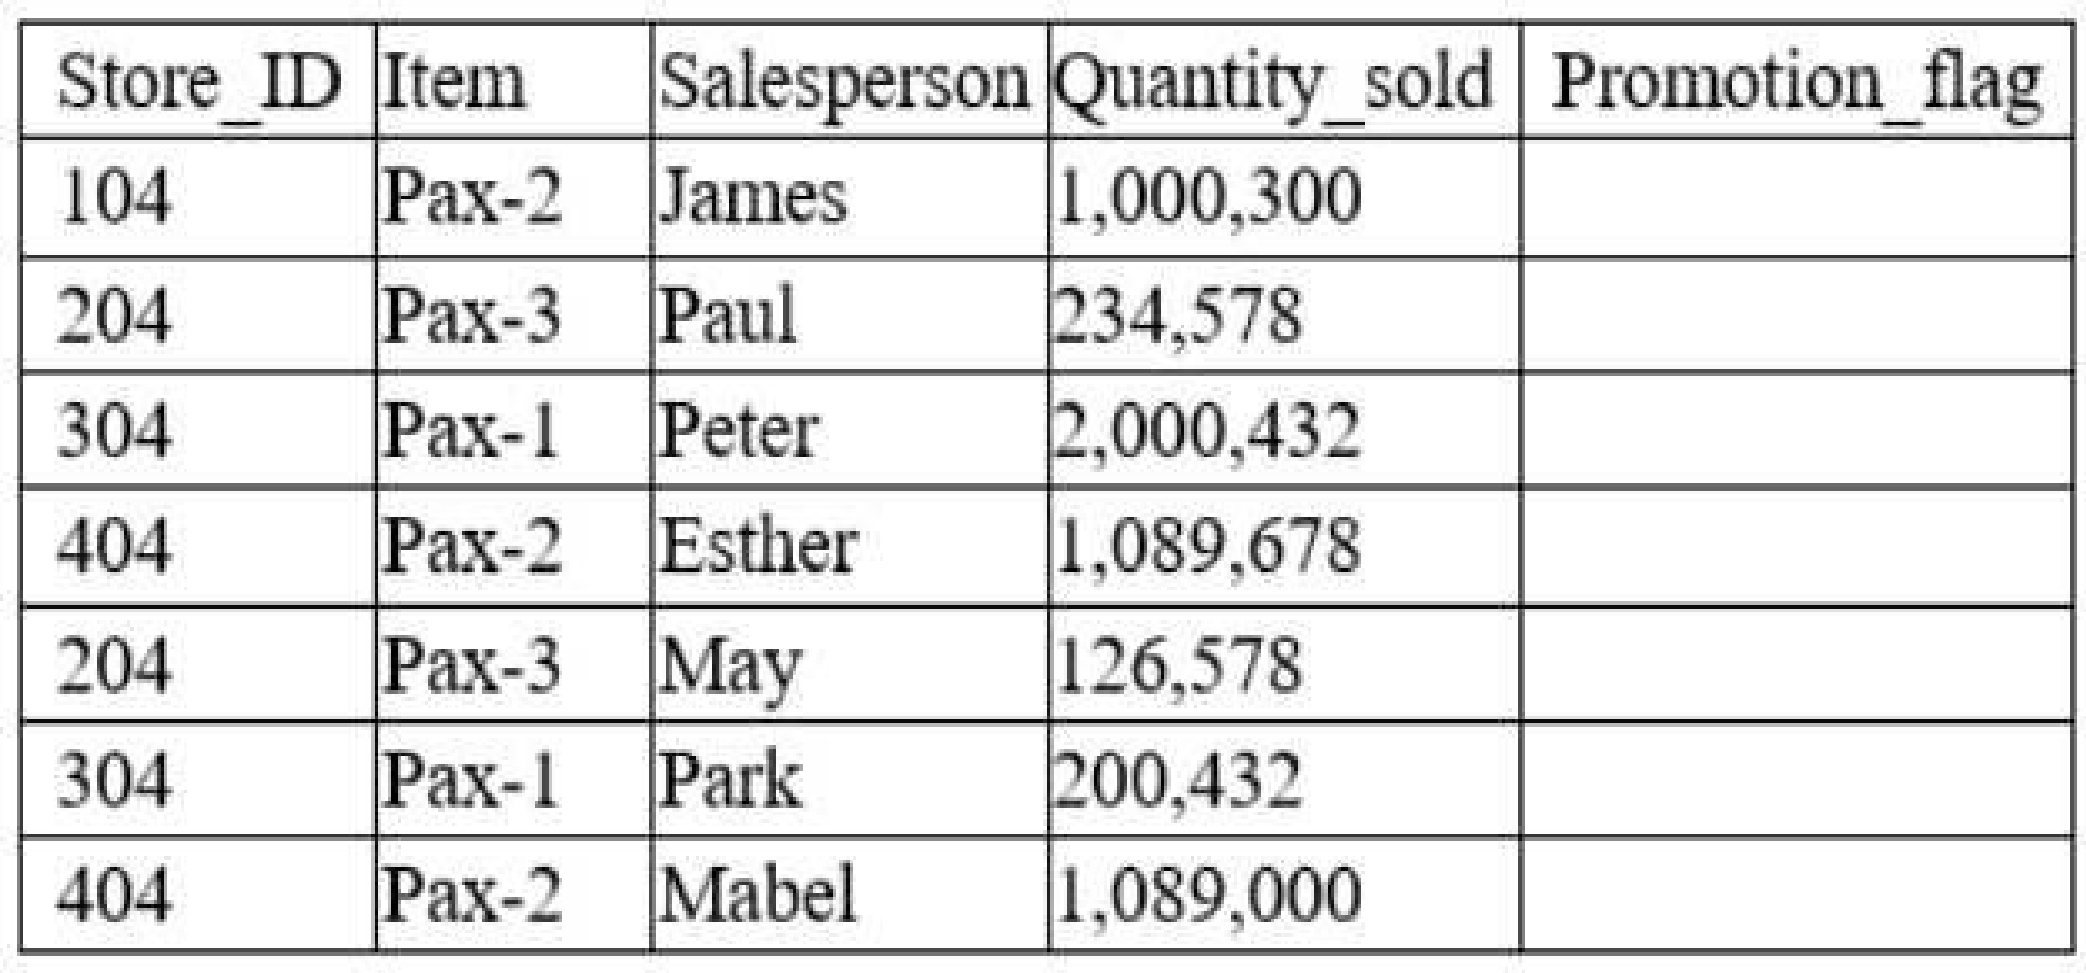
A data analyst has been asked to derive a new variable labeled “Promotion_flag” based on the total quantity sold by each salesperson. Given the table below: v
Which of the following functions would the analyst consider appropriate to flag “Yes” for every salesperson who has a number above 1,000,000 in the Quantity_sold column?
Select the answer:Select the answer
1 correct answer
A.
Date
B.
Mathematical
C.
Logical
D.
Aggregate
A logical function is a type of function that returns a value based on a condition or a set of conditions. For example, the IF function in Excel can be used to check if a certain condition is met, and then return one value if true, and another value if false. In this case, the data analyst can use a logical function to check if the Quantity_sold column is greater than 1,000,000, and then return “Yes” if true, and “No” if false. This would create a new variable called Promotion_flag that indicates whether the salesperson has sold more than 1,000,000 units or not. Reference: CompTIA Data+ Certification Exam Objectives, Logical functions (reference)
Right Answer: C
Quiz
Question 9/109/10
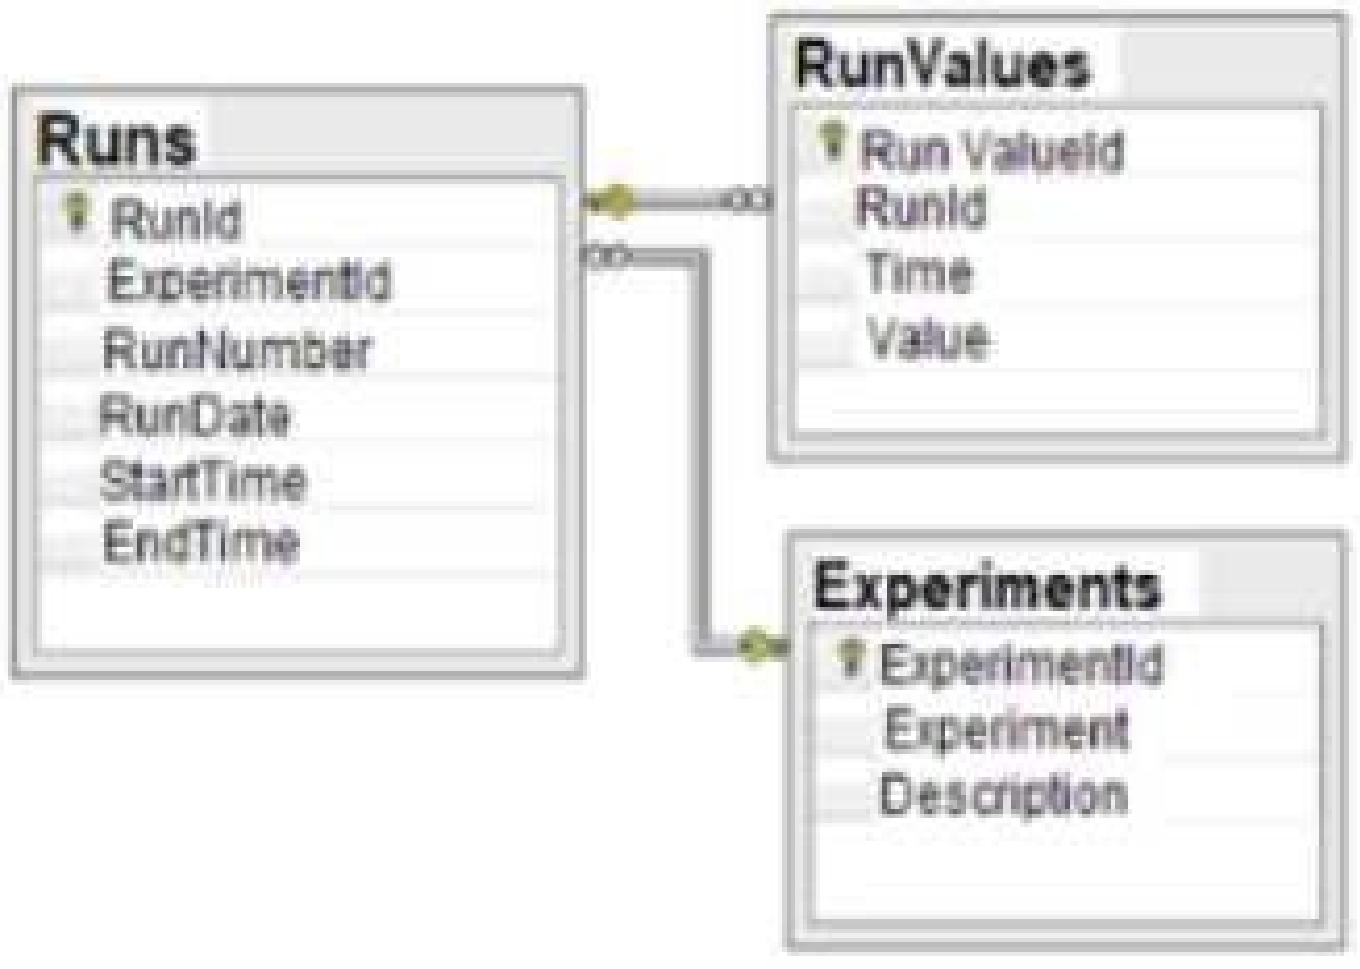
Given the diagram below: v
Which of the following data schemas shown?
Select the answer:Select the answer
1 correct answer
A.
Key-value pairs
B.
Online transactional processing
C.
Data Lake
D.
Relational database
A relational database is a type of database that organizes data into tables, where each table has a fixed number of columns and a variable number of rows. Each row in a table represents a record or an entity, and each column represents an attribute or a property of that entity. The tables are linked by common fields, called keys, which enable the database to establish relationships between the data. A relational database schema is a diagram that shows the structure and organization of the tables, columns, keys, and constraints in a relational database. The diagram given in the question isan example of a relational database schema, as it shows two tables: “Runs” and “Experiments”, with their respective columns, data types, and primary keys. The “Runs” table also has a foreign key that references the “ExperimentId” column in the “Experiments” table, indicating a relationship between the two tables. Therefore, the correct answer is D. Reference: What is a database schema? | IBM, Database Schema - Javatpoint
Right Answer: D
Quiz
Question 10/1010/10
A company’s marketing department wants to do a promotional campaign next month. A data analyst on the team has been asked to perform customer segmentation, looking at how recently a customer bought the product, at what frequency, and at what value. Which of the following types of analysis would this practice be considered? v
Select the answer:Select the answer
1 correct answer
A.
Prescriptive
B.
Trend
C.
Gap
D.
Custer
Customer segmentation is a type of cluster analysis, which is a method of grouping data points based on their similarities or differences. Cluster analysis can help identify patterns and trends in the data, as well as target specific groups of customers for marketing purposes. One common technique for customer segmentation is RFM analysis, which stands for recency, frequency, and monetary value. This technique assigns a score to each customer based on how recently they bought the product, how often they buy the product, and how much they spend on the product. These scores can then be used to create clusters of customers with different characteristics and preferences. Therefore, the correct answer is D. Reference: Cluster Analysis - Statistics Solutions, RFM Analysis: The Ultimate Guide for Customer Segmentation
DA0-001: CompTIA Data+ Certification Practice test unlocks all online simulator questions
Thank you for choosing the free version of the DA0-001: CompTIA Data+ Certification practice test! Further deepen your knowledge on CompTIA Simulator; by unlocking the full version of our DA0-001: CompTIA Data+ Certification Simulator you will be able to take tests with over 363 constantly updated questions and easily pass your exam. 98% of people pass the exam in the first attempt after preparing with our 363 questions.
What to expect from our DA0-001: CompTIA Data+ Certification practice tests and how to prepare for any exam?
The DA0-001: CompTIA Data+ Certification Simulator Practice Tests are part of the CompTIA Database and are the best way to prepare for any DA0-001: CompTIA Data+ Certification exam. The DA0-001: CompTIA Data+ Certification practice tests consist of 363 questions and are written by experts to help you and prepare you to pass the exam on the first attempt. The DA0-001: CompTIA Data+ Certification database includes questions from previous and other exams, which means you will be able to practice simulating past and future questions. Preparation with DA0-001: CompTIA Data+ Certification Simulator will also give you an idea of the time it will take to complete each section of the DA0-001: CompTIA Data+ Certification practice test . It is important to note that the DA0-001: CompTIA Data+ Certification Simulator does not replace the classic DA0-001: CompTIA Data+ Certification study guides; however, the Simulator provides valuable insights into what to expect and how much work needs to be done to prepare for the DA0-001: CompTIA Data+ Certification exam.
DA0-001: CompTIA Data+ Certification Practice test therefore represents an excellent tool to prepare for the actual exam together with our CompTIA practice test . Our DA0-001: CompTIA Data+ Certification Simulator will help you assess your level of preparation and understand your strengths and weaknesses. Below you can read all the quizzes you will find in our DA0-001: CompTIA Data+ Certification Simulator and how our unique DA0-001: CompTIA Data+ Certification Database made up of real questions:
Info quiz:
Quiz name:DA0-001: CompTIA Data+ Certification
Total number of questions:363
Number of questions for the test:50
Pass score:80%
You can prepare for the DA0-001: CompTIA Data+ Certification exams with our mobile app. It is very easy to use and even works offline in case of network failure, with all the functions you need to study and practice with our DA0-001: CompTIA Data+ Certification Simulator.
Use our Mobile App, available for both Android and iOS devices, with our DA0-001: CompTIA Data+ Certification Simulator . You can use it anywhere and always remember that our mobile app is free and available on all stores.
Our Mobile App contains all DA0-001: CompTIA Data+ Certification practice tests which consist of 363 questions and also provide study material to pass the final DA0-001: CompTIA Data+ Certification exam with guaranteed success.
Our DA0-001: CompTIA Data+ Certification database contain hundreds of questions and CompTIA Tests related to DA0-001: CompTIA Data+ Certification Exam. This way you can practice anywhere you want, even offline without the internet.