Quiz
you can create the relationship?
Quiz
Query Editor?
Quiz
Which DAX expression should you use?
Quiz
Quiz
reporting requirements of the regional managers. What should you do?
yyyymmdd and use the calculated column to create a relationship to the Date table.
many relationship to Weekly_Return.
Quiz
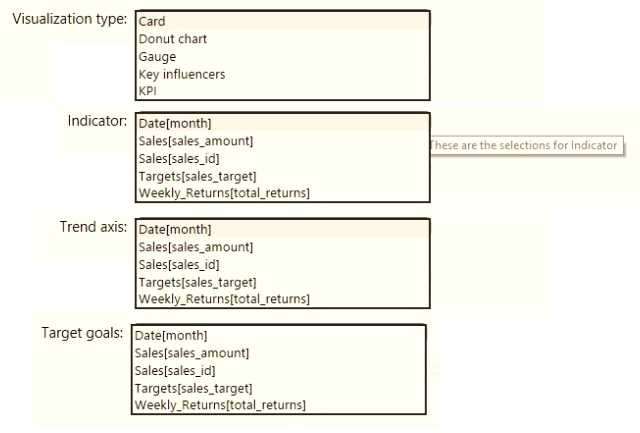
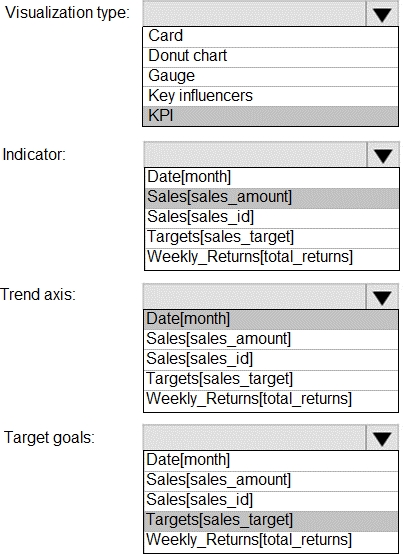
You need to create a visualization to meet the reporting requirements of the sales managers.
How should you create the visualization? To answer, select the appropriate options in the answer
area.
NOTE: Each correct selection is worth one point.


Quiz
What should you include in the solution?
username = UserName()
sales_manager_id = UserPrincipalName().
name = UserName().
username = sales_manager_id.
Quiz
department.
What should you create?
Sales[sales_date_id] to Date[date_id], and a one-to-many relationship from
Sales[sales_ship_date_id] to ShipDate[date_id]
Sales[sales_date_id] to Date[date_id], and a many-to-many relationship from
Sales[sales_ship_date_id] to ShipDate[date_id]
relationship from Date[date_id] to Weekly_Returns[week_id]
relationship from Sales[sales_ship_date_id] to Date[date_id]
relationship from Date[date_id] to Sales[sales_ship_date_id]
Quiz
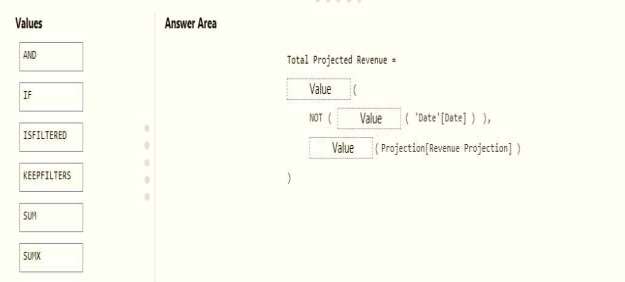
You need to create a DAX measure in the data model that only allows users to see projections at the
appropriate levels of granularity.
How should you complete the measure? To answer, drag the appropriate values to the correct
targets. Each value may be used once, more than once, or not at all. You may need to drag the split
bar between panes or scroll to view content.
NOTE: Each correct selection is worth one point.


Quiz
You need to calculate the last day of the month in the balance sheet data to ensure that you can
relate the balance sheet data to the Date table. Which type of calculation and which formula should
you use? To answer, select the appropriate options in the answer are
a. NOTE: Each correct selection is worth one point.


Microsoft Analyzing Data with Microsoft Power BI Practice test unlocks all online simulator questions
Thank you for choosing the free version of the Microsoft Analyzing Data with Microsoft Power BI practice test! Further deepen your knowledge on Microsoft Simulator; by unlocking the full version of our Microsoft Analyzing Data with Microsoft Power BI Simulator you will be able to take tests with over 149 constantly updated questions and easily pass your exam. 98% of people pass the exam in the first attempt after preparing with our 149 questions.
BUY NOWWhat to expect from our Microsoft Analyzing Data with Microsoft Power BI practice tests and how to prepare for any exam?
The Microsoft Analyzing Data with Microsoft Power BI Simulator Practice Tests are part of the Microsoft Database and are the best way to prepare for any Microsoft Analyzing Data with Microsoft Power BI exam. The Microsoft Analyzing Data with Microsoft Power BI practice tests consist of 149 questions and are written by experts to help you and prepare you to pass the exam on the first attempt. The Microsoft Analyzing Data with Microsoft Power BI database includes questions from previous and other exams, which means you will be able to practice simulating past and future questions. Preparation with Microsoft Analyzing Data with Microsoft Power BI Simulator will also give you an idea of the time it will take to complete each section of the Microsoft Analyzing Data with Microsoft Power BI practice test . It is important to note that the Microsoft Analyzing Data with Microsoft Power BI Simulator does not replace the classic Microsoft Analyzing Data with Microsoft Power BI study guides; however, the Simulator provides valuable insights into what to expect and how much work needs to be done to prepare for the Microsoft Analyzing Data with Microsoft Power BI exam.
BUY NOWMicrosoft Analyzing Data with Microsoft Power BI Practice test therefore represents an excellent tool to prepare for the actual exam together with our Microsoft practice test . Our Microsoft Analyzing Data with Microsoft Power BI Simulator will help you assess your level of preparation and understand your strengths and weaknesses. Below you can read all the quizzes you will find in our Microsoft Analyzing Data with Microsoft Power BI Simulator and how our unique Microsoft Analyzing Data with Microsoft Power BI Database made up of real questions:
Info quiz:
- Quiz name:Microsoft Analyzing Data with Microsoft Power BI
- Total number of questions:149
- Number of questions for the test:50
- Pass score:80%
You can prepare for the Microsoft Analyzing Data with Microsoft Power BI exams with our mobile app. It is very easy to use and even works offline in case of network failure, with all the functions you need to study and practice with our Microsoft Analyzing Data with Microsoft Power BI Simulator.
Use our Mobile App, available for both Android and iOS devices, with our Microsoft Analyzing Data with Microsoft Power BI Simulator . You can use it anywhere and always remember that our mobile app is free and available on all stores.
Our Mobile App contains all Microsoft Analyzing Data with Microsoft Power BI practice tests which consist of 149 questions and also provide study material to pass the final Microsoft Analyzing Data with Microsoft Power BI exam with guaranteed success. Our Microsoft Analyzing Data with Microsoft Power BI database contain hundreds of questions and Microsoft Tests related to Microsoft Analyzing Data with Microsoft Power BI Exam. This way you can practice anywhere you want, even offline without the internet.
BUY NOW